


Invoice Complete
D'atalier has developed an interactive dashboard for InvoiceComplete, giving the company deep insight into the financial data of procurement processes. This dashboard visualises spending patterns, supplier performance and invoice trends using clear charts and tables. The system integrates data from various sources, enabling real-time updates and analysis. Users can easily apply filters to analyse specific data and generate reports.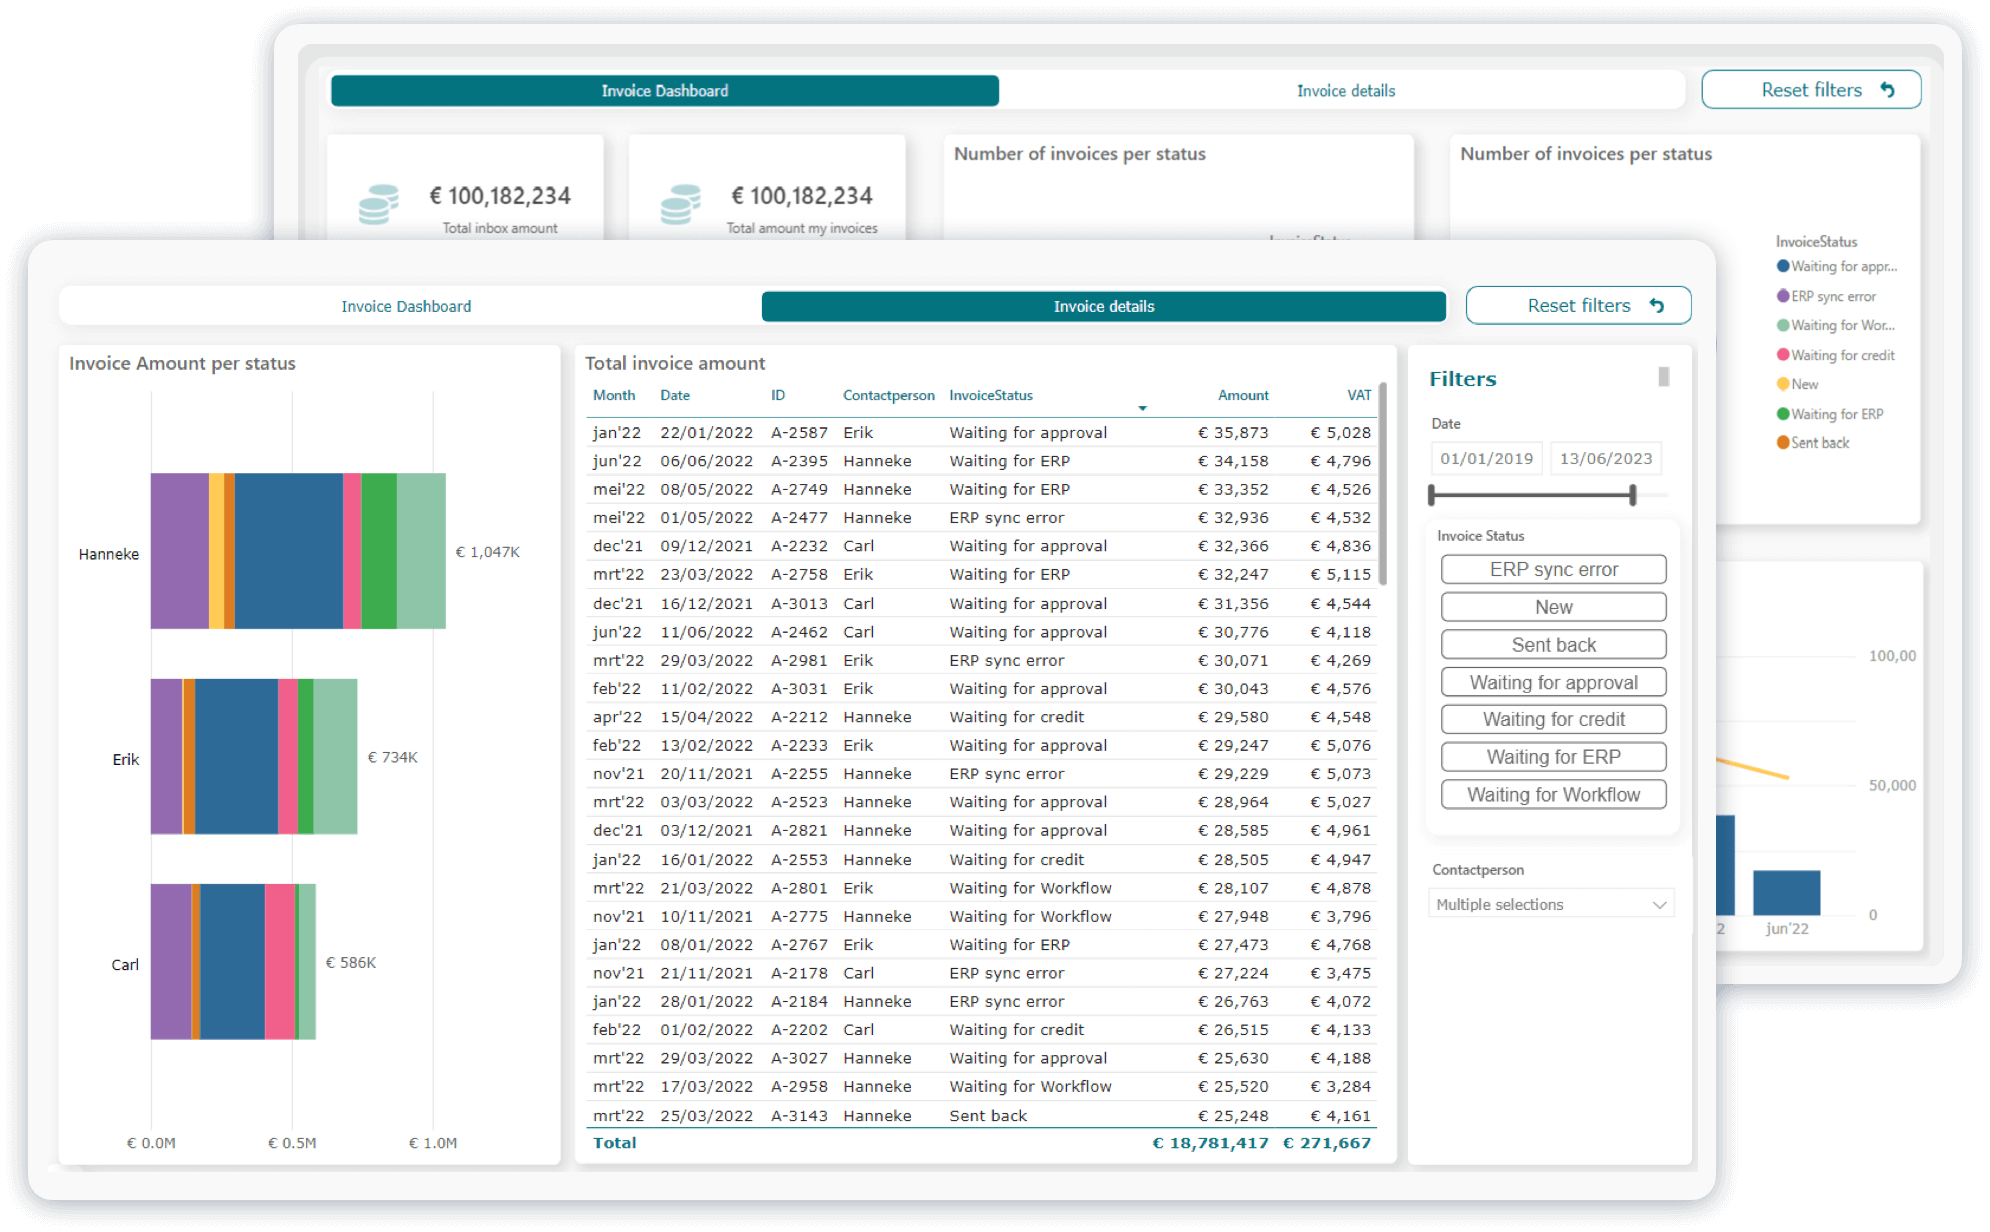
Rietlanden
D'atalier has developed an interactive dashboard for Rietlanden that provides the company with in-depth insight into operational data from transshipment operations. This dashboard visualizes logistics patterns, crane and terminal performance, and trend analysis through clear charts and tables. It integrates data from various sources for real-time updates and analysis. Users can easily apply filters for specific data analysis and report generation.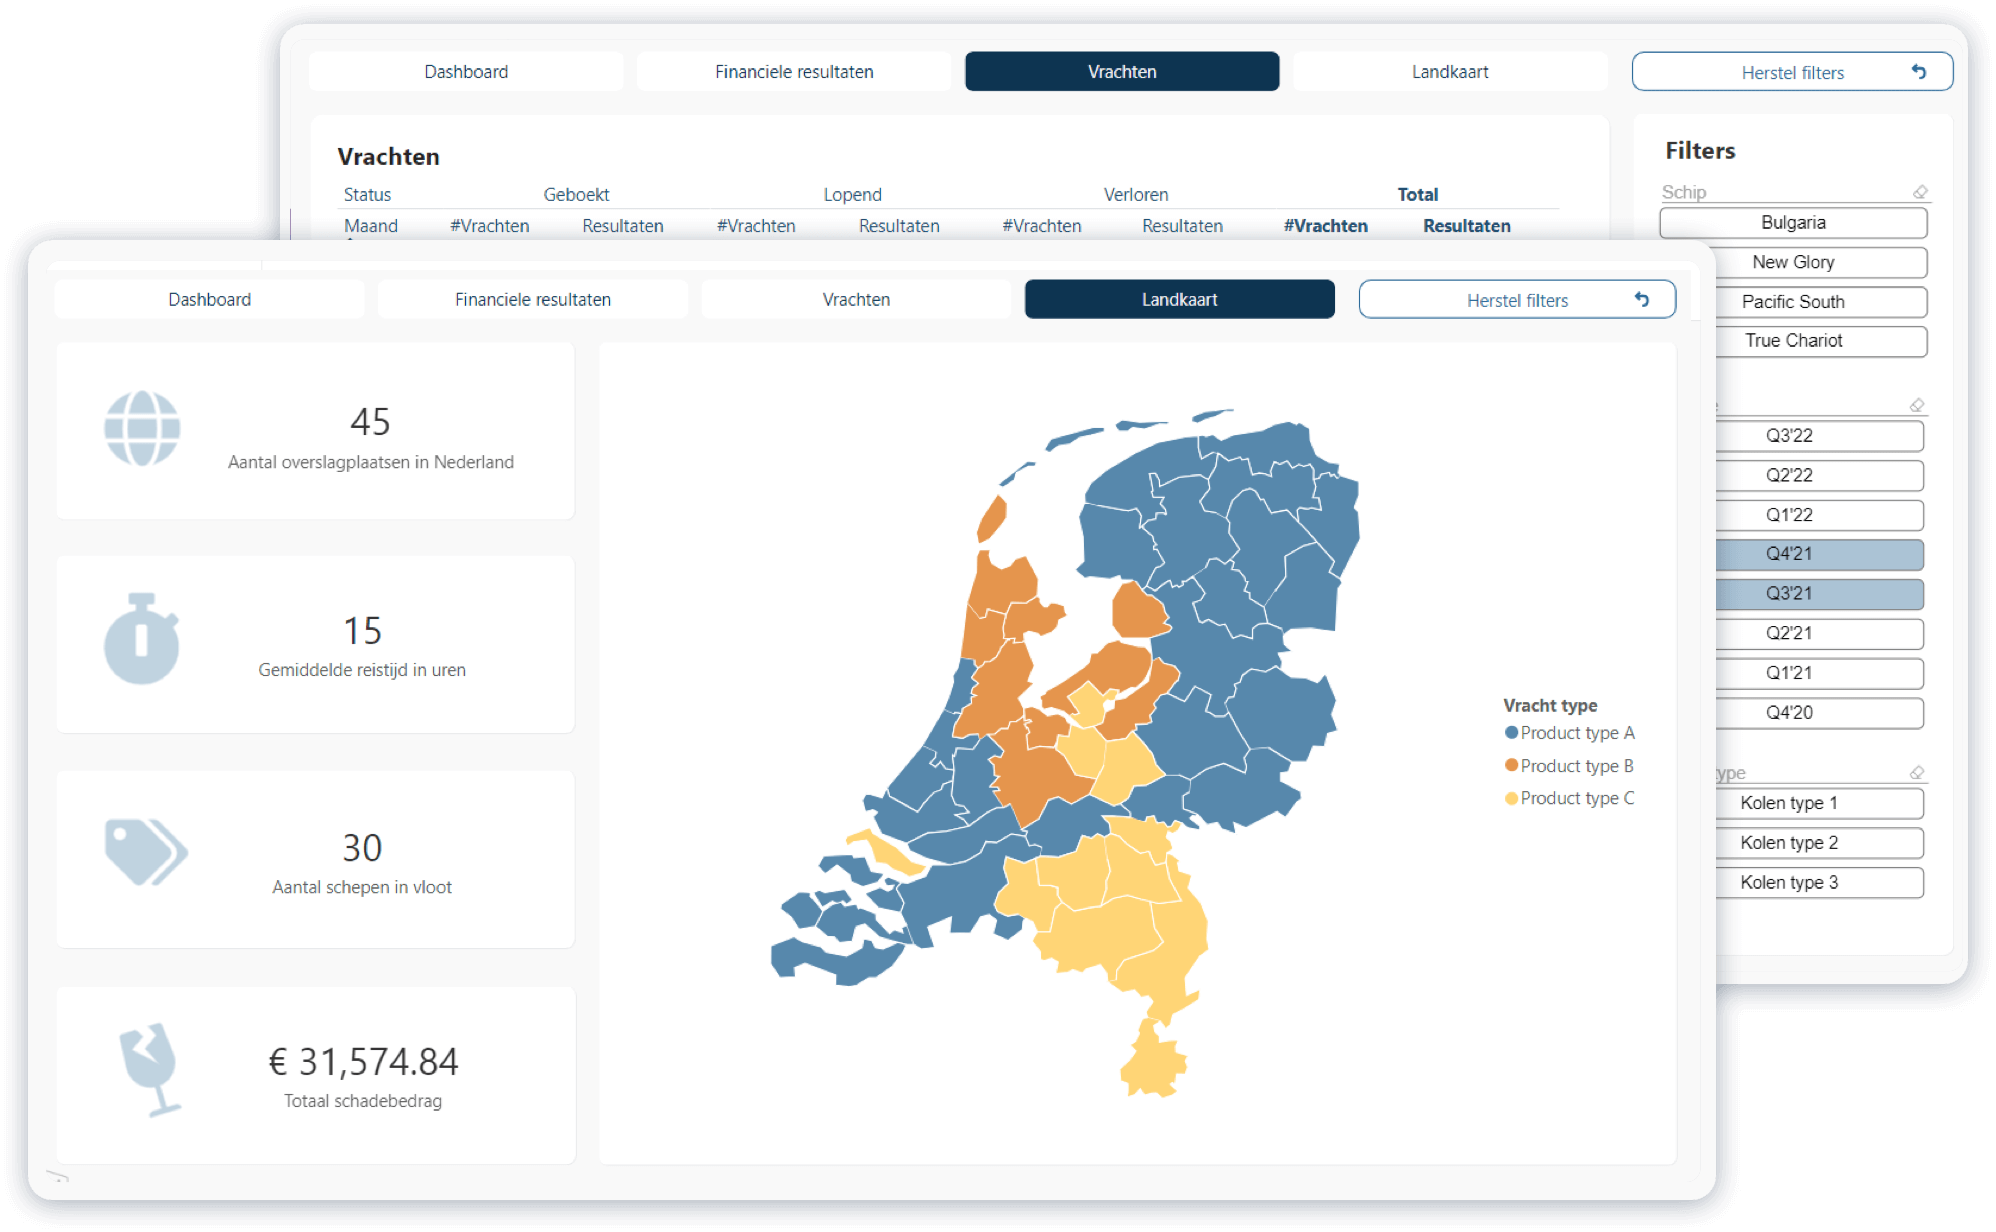
Green Delivr
D'atalier has developed an interactive dashboard for GreenDelivr, giving the company deep insight into the logistics data of their last mile delivery services. This dashboard visualizes delivery patterns, courier performance statistics and trend analysis through clear charts and tables. It integrates data from various sources for real-time updates and analysis. Users can easily apply filters for specific data analysis and report generation.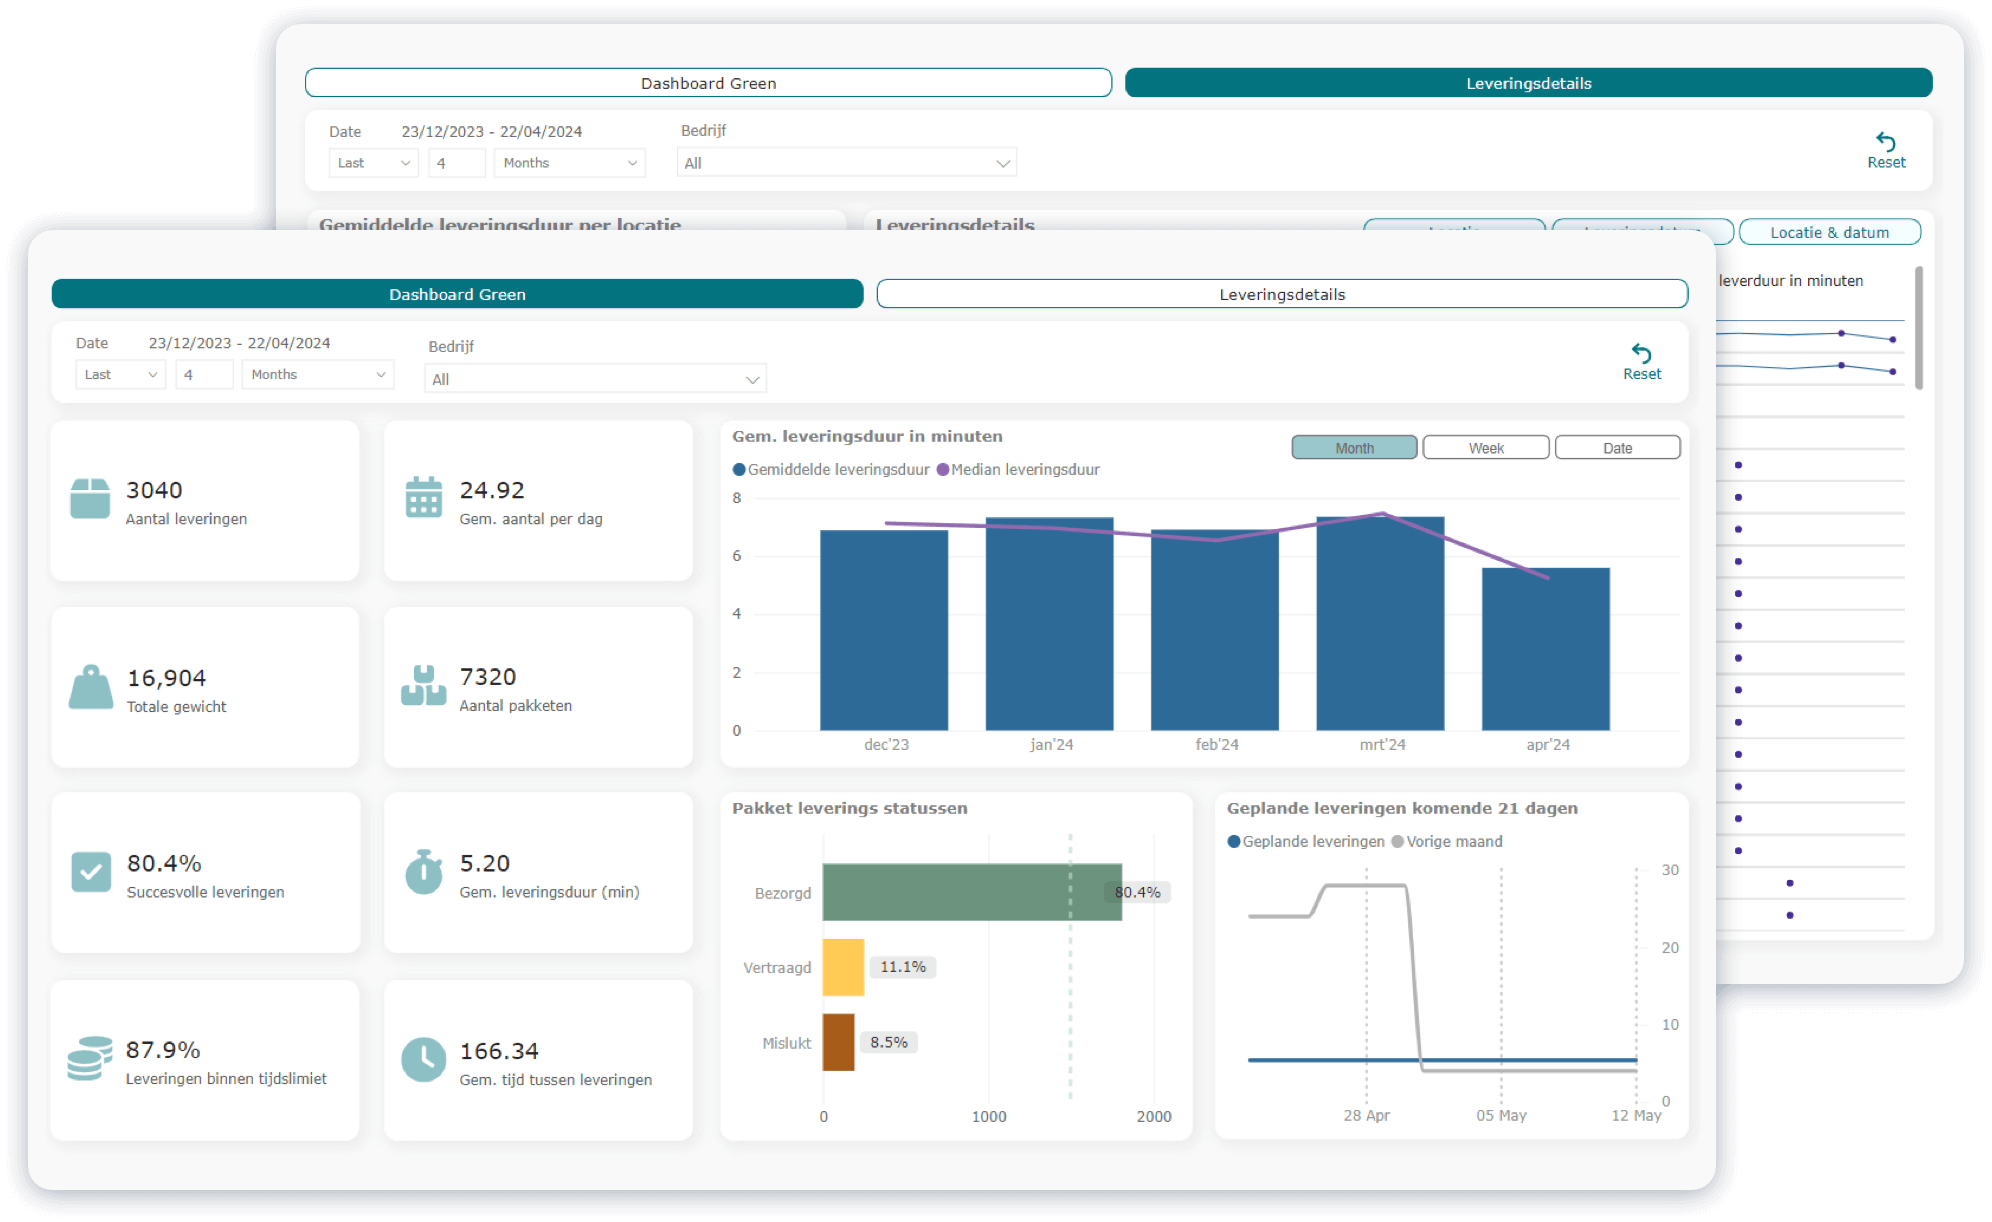