KPI dashboard from D'atalier
Would you like to use a customised KPI dashboard for your organisation? Contact D’atalier for a no-obligation demo and find out how to get more insight and control over your KPIs.
10+
Years of experience
120+
Completed projects
10+
Professionals
D'atalier. The ultimate KPI dashboard
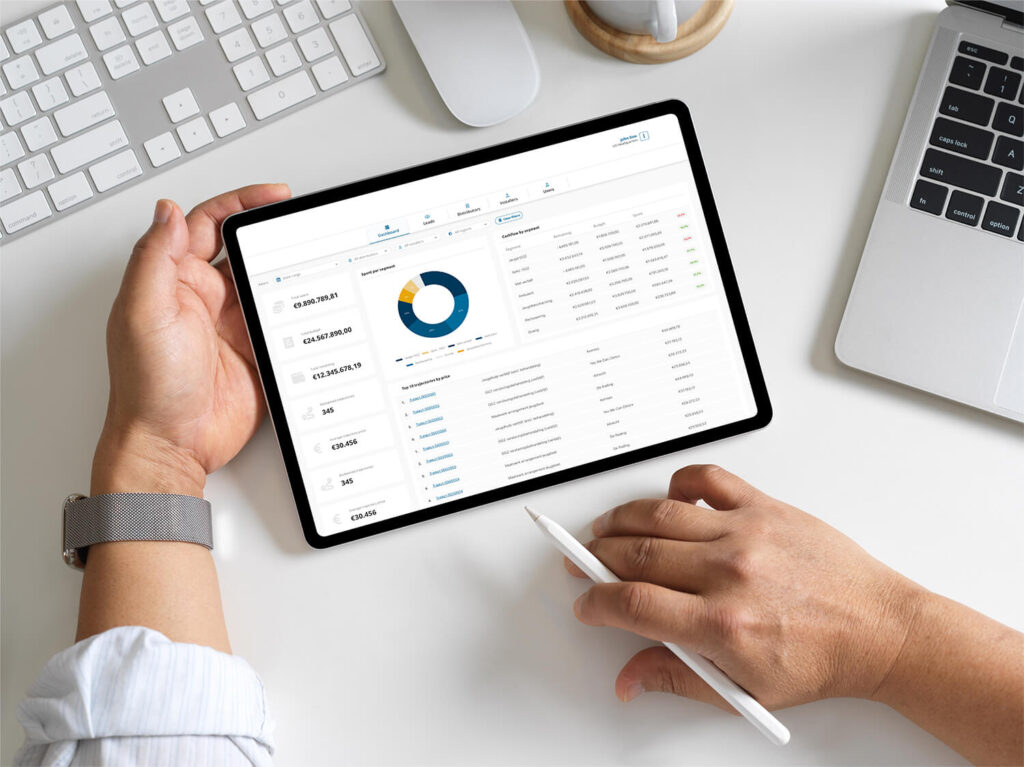
Are you looking for a KPI dashboard that gives you more insight into your data? Then we can help you with that. D’atalier makes it easy to track your company’s performance by bringing together important data in a dashboard.
We are happy to show you how we can create a KPI dashboard for various purposes within your organisation. D’atalier is web-based, relevant insights are always and everywhere accessible for authorised employees.
How is D'atalier's KPI dashboard put together?
We know all too well that every organisation has unique KPIs. This is why our KPI dashboard is customised. This gives you insight into relevant business data at a glance.
Together with you, we look at your situation and determine which KPIs should be reflected in your dashboard. The perfect dashboard is simple, complete and easy to understand for everyone on your team.
What do we offer?

Report
Using D'atalier saves valuable time and effort. With a single click, reports are generated based on key data from various sources.
Visualisation
From raw data to insight through clear customised dashboards. D'atalier converts your data into graphs and/or other graphic representations.
Dashboarding
Our dashboard solution processes important data from various sources into dashboards. This is very useful if you have large amounts of data.
Interpretation
You can get a clear picture of your company's data by using a single dashboard. You have access to all the information you need, when and where you want it.
Make data-driven decisions with dashboarding from D'atalier
The future of any business depends on well-informed decisions. One of the most efficient ways to make decisions in your business is to collect all the data you receive and turn it into actionable information.
By using all the data your business generates, you can streamline workflows and make processes more efficient. Wondering what we can do for your organisation? Contact us for a no-obligation demo.

Benefits of
KPI in dashboard
Implementing KPI dashboard in your business strategy offers numerous benefits. It allows you to track real-time performance, identify trends, pinpoint bottlenecks and make proactive decisions. Our solutions take your business analytics to the next level.
Knowledge-based
Make important decisions based on real-time data.
Clear analyses
Relevant data is incorporated into clear charts and tables.
Optimising business processes
Look critically at existing business processes so that they can be optimised.
Detecting abnormalities
Gain new insights and detect anomalies in complex business processes.
One version of the truth
Everyone in the company gets one central version of the truth.
Integration with existing systems
Our dashboard is tailor-made for your optimal use.
Take advantage of the variousdashboard KPI features D'atalier has to offer
A high-quality dashboard prevents unnecessary discussions between team members due to misinterpretation of data. This is because a single version of the truth is created. This allows decisions to be made on the basis of hard data that can be understood by everyone.
Visualisation of data
Visualise complex data in an ordered manner for easy interpretation.
Machine learning / AI
Use machine learning and AI to gather even more insights from the data.
Process mining
Analyse operational processes based on data logs to turn event data into insights and matching actions.
Collaboration
By working with you, we create customised dashboards that give you the insights that match your needs.
Datamining
Focus on statistical relationships between different measurement data, pattern recognition, and predictive models.
Natural Language Processing
Not all data is structured, Natural Language Processing can be used to understand textual content.
Invoice Complete
D'atalier has developed an interactive dashboard for InvoiceComplete, giving the company deep insight into the financial data of procurement processes. This dashboard visualises spending patterns, supplier performance and invoice trends using clear charts and tables. The system integrates data from various sources, enabling real-time updates and analysis. Users can easily apply filters to analyse specific data and generate reports.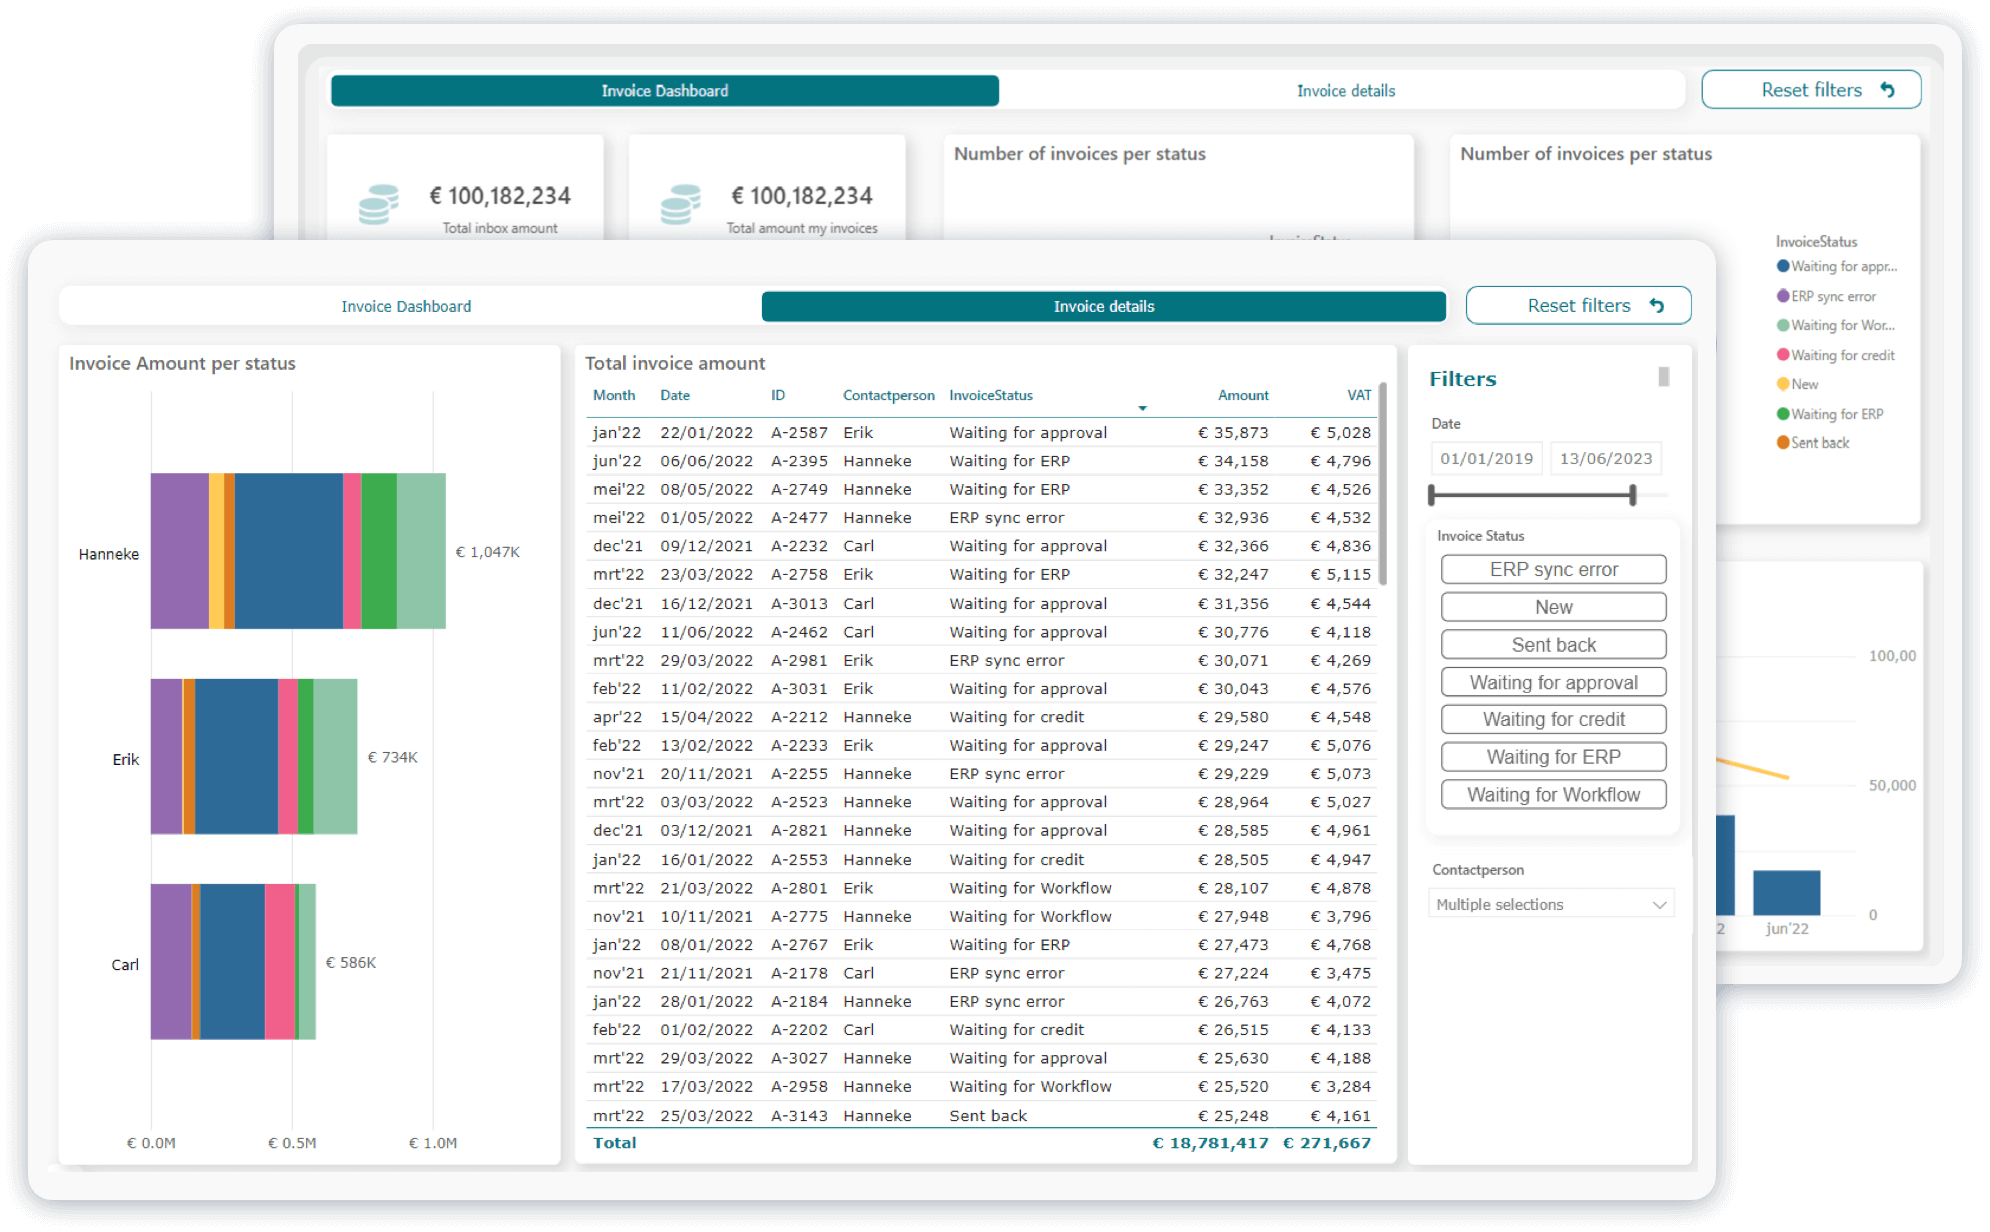
Rietlanden
D'atalier has developed an interactive dashboard for Rietlanden that provides the company with in-depth insight into operational data from transshipment operations. This dashboard visualizes logistics patterns, crane and terminal performance, and trend analysis through clear charts and tables. It integrates data from various sources for real-time updates and analysis. Users can easily apply filters for specific data analysis and report generation.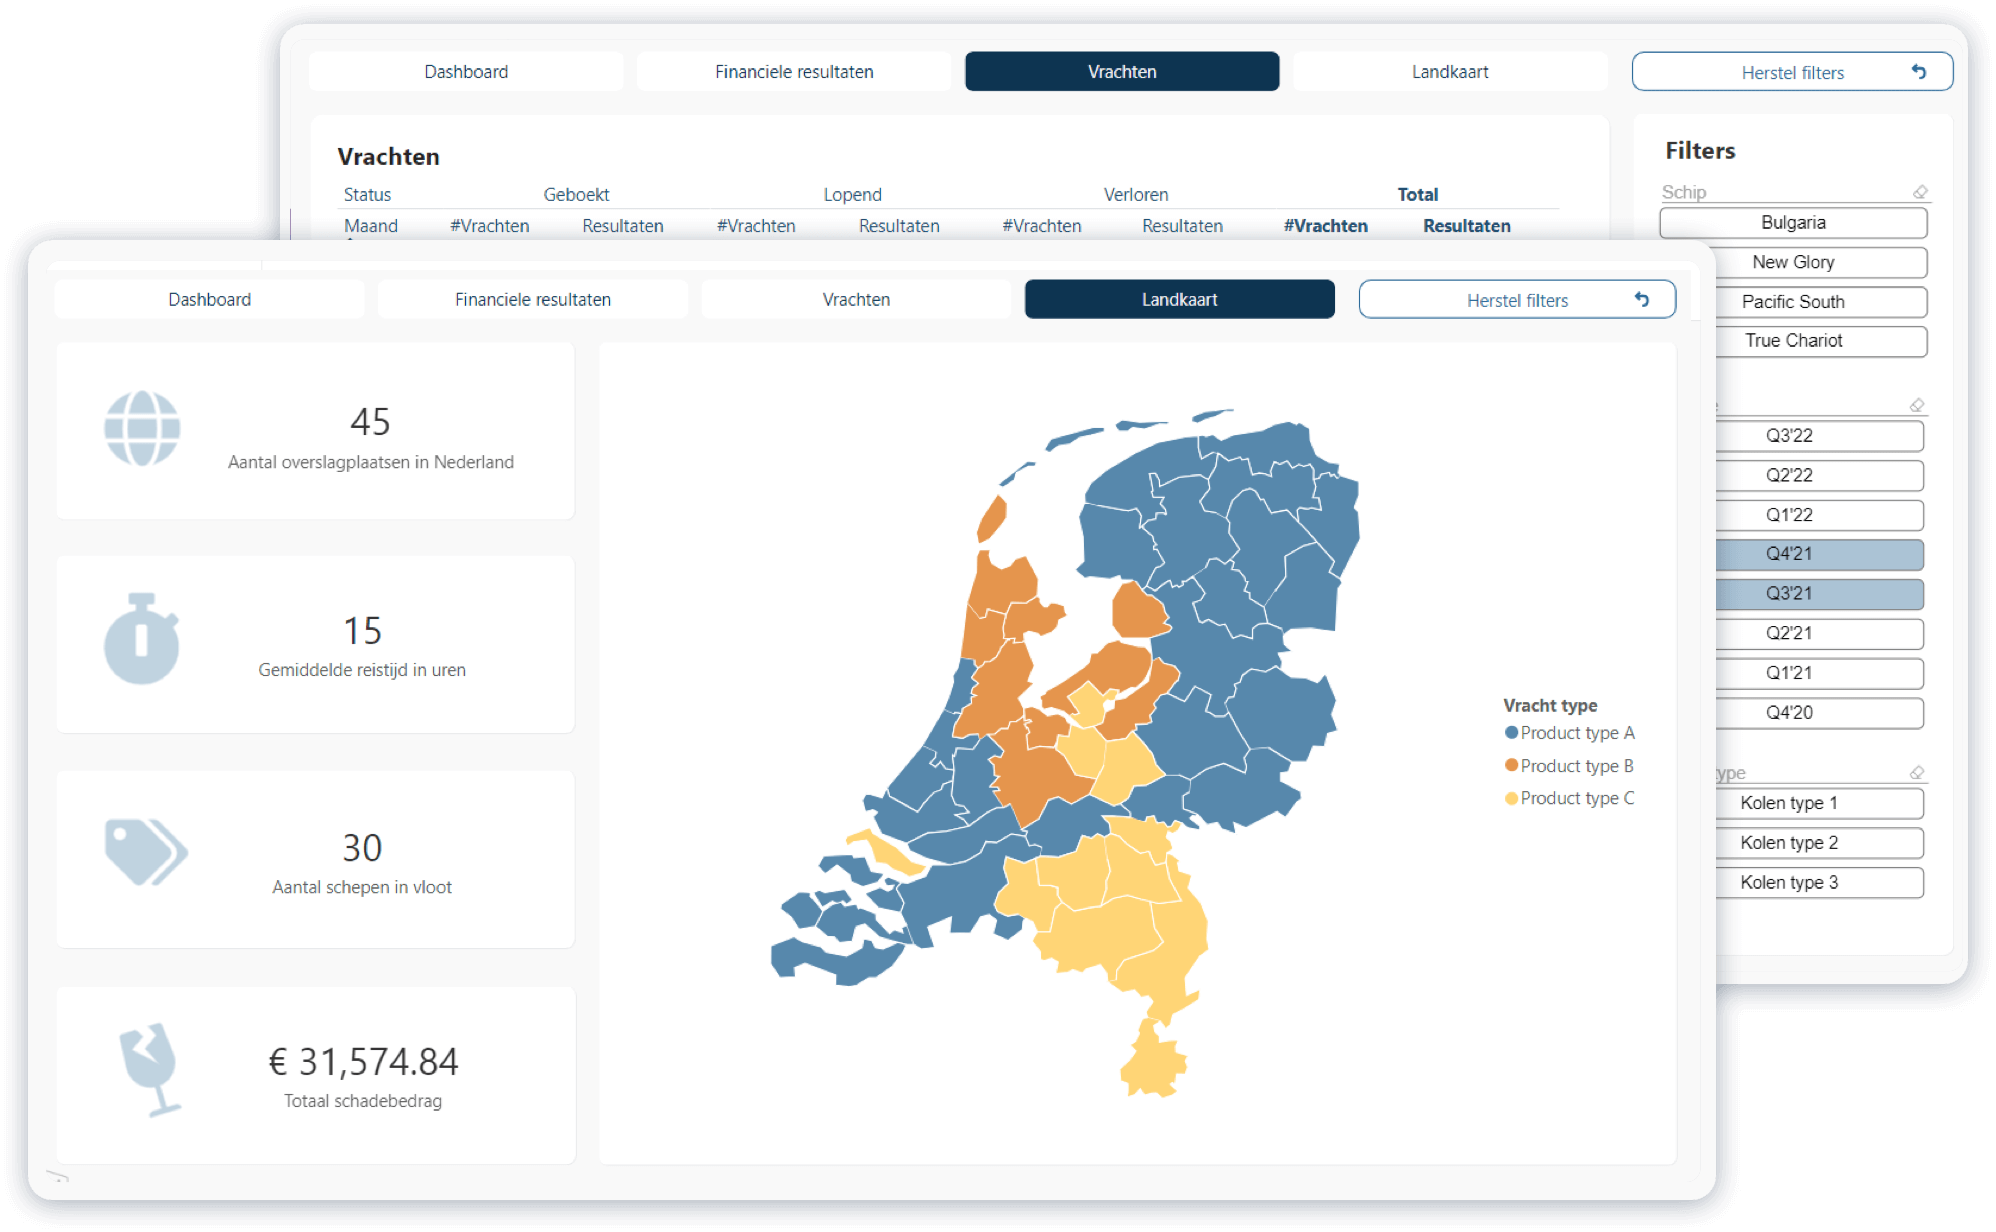
Green Delivr
D'atalier has developed an interactive dashboard for GreenDelivr, giving the company deep insight into the logistics data of their last mile delivery services. This dashboard visualizes delivery patterns, courier performance statistics and trend analysis through clear charts and tables. It integrates data from various sources for real-time updates and analysis. Users can easily apply filters for specific data analysis and report generation.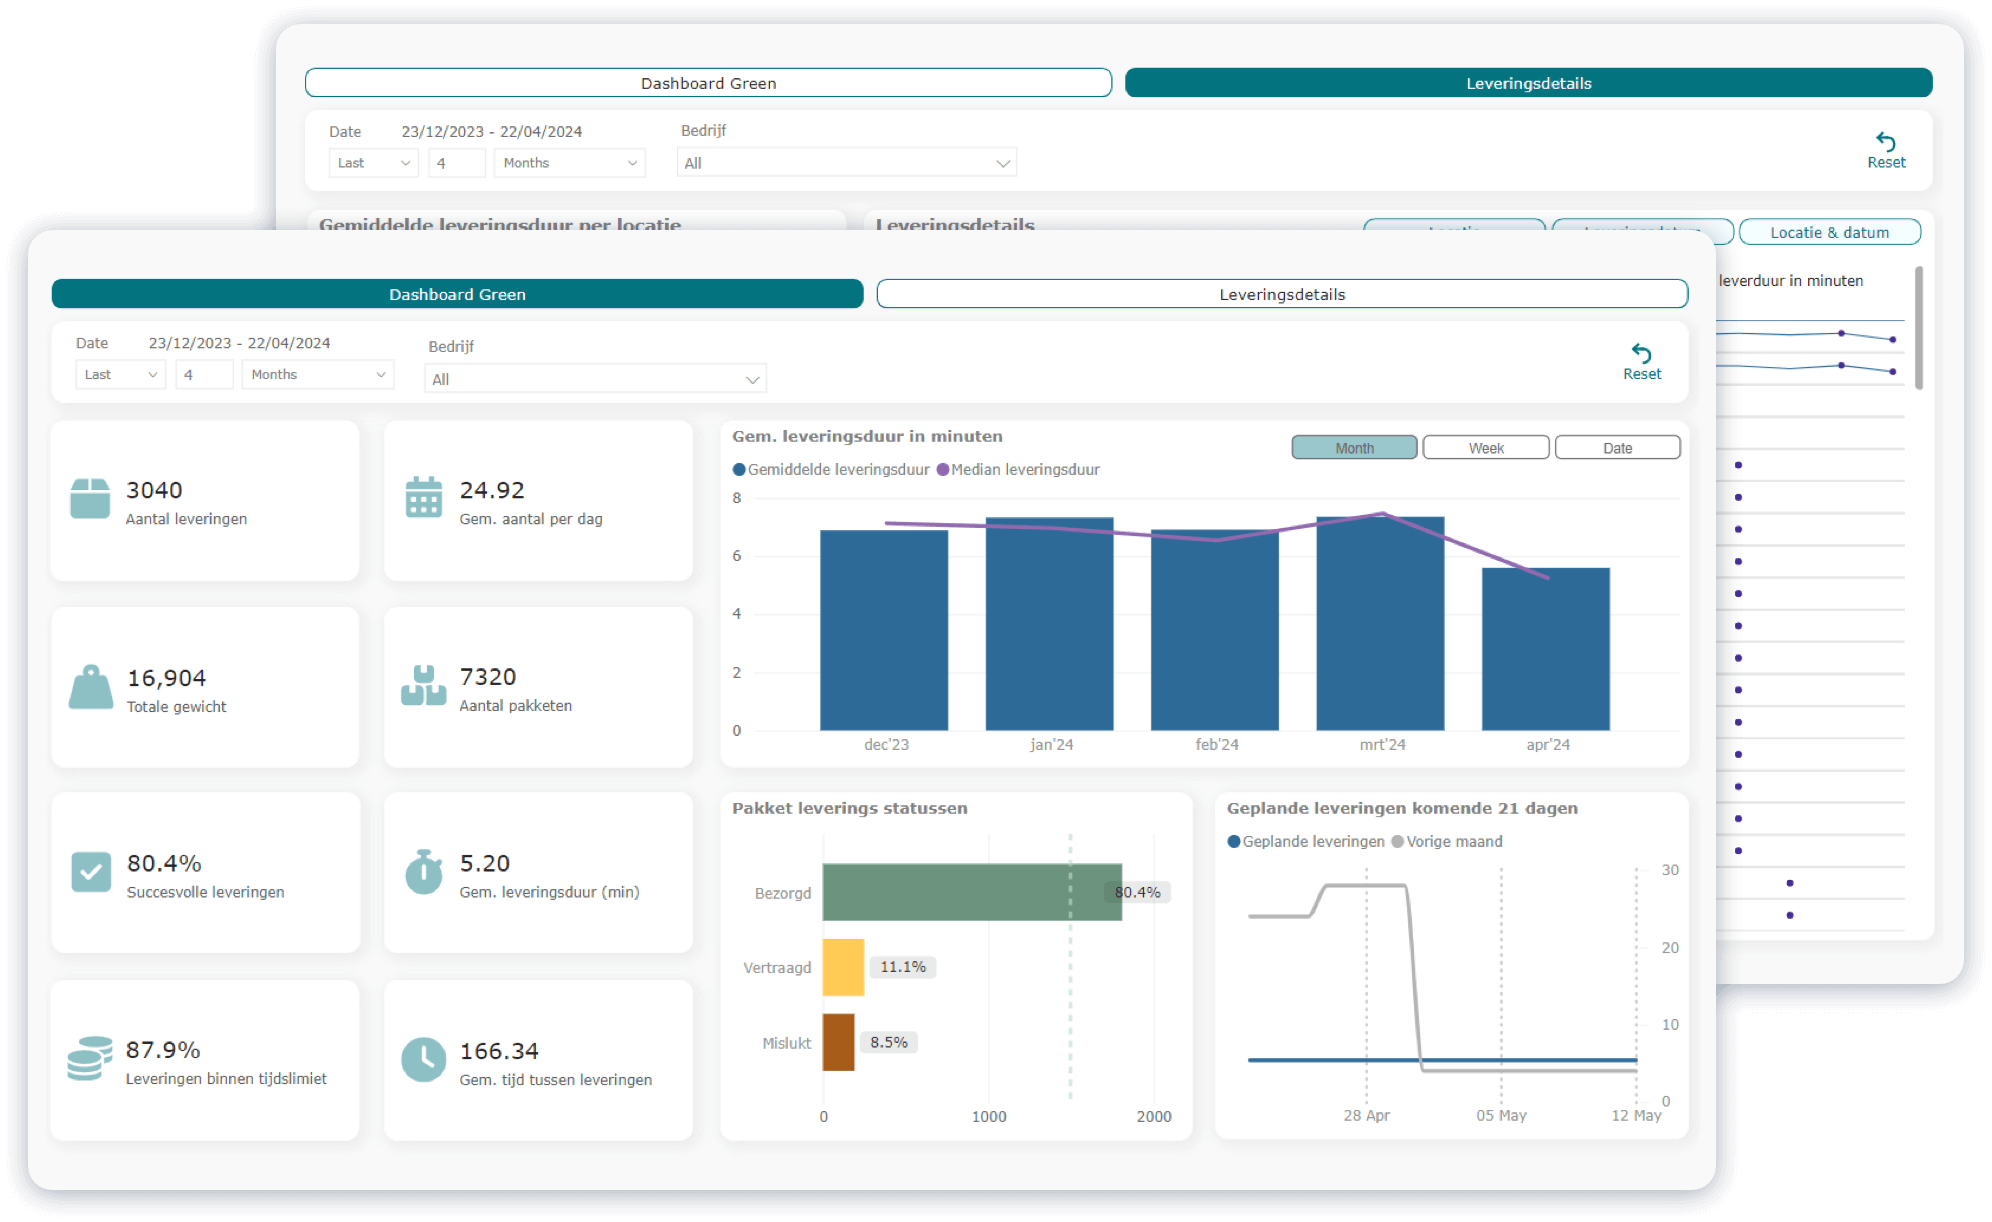
Invoice Complete
D'atalier has developed an interactive dashboard for InvoiceComplete, giving the company deep insight into the financial data of procurement processes. This dashboard visualises spending patterns, supplier performance and invoice trends using clear charts and tables. The system integrates data from various sources, enabling real-time updates and analysis. Users can easily apply filters to analyse specific data and generate reports.
Rietlanden
D'atalier has developed an interactive dashboard for Rietlanden that provides the company with in-depth insight into operational data from transshipment operations. This dashboard visualizes logistics patterns, crane and terminal performance, and trend analysis through clear charts and tables. It integrates data from various sources for real-time updates and analysis. Users can easily apply filters for specific data analysis and report generation.
Green Delivr
D'atalier has developed an interactive dashboard for GreenDelivr, giving the company deep insight into the logistics data of their last mile delivery services. This dashboard visualizes delivery patterns, courier performance statistics and trend analysis through clear charts and tables. It integrates data from various sources for real-time updates and analysis. Users can easily apply filters for specific data analysis and report generation.
Request a demo
Interested in what D’atalier’s dashboarding solutions can do for your business? Contact us for more information or request a demo. Our team is ready to help you take the next step in data-driven decision-making.

