D’atalier Datascan
D’atalier’s Data Maturity Scan is a crucial step for companies aiming to work efficiently and become data-driven. This scan provides numerous benefits:

The benefits

Expert execution
Each scan is performed by an experienced data specialist from D'atalier. These specialists bring a deep understanding of data analysis and strategies, ensuring an accurate and reliable scan.
Detailed GAP analysis
We offer a thorough GAP analysis concentrating on data-driven operations, helping to identify gaps between your current data strategy and its desired performance.
Lays the foundation for data-driven working
The scan lays a solid foundation for your organisation to develop and maintain an effective data-driven culture, which is essential for modern business operations.
Clear conclusions and recommendations
After the scan, you will receive clear conclusions and recommendations. These insights are crucial for making informed decisions on how to improve your data strategy.
Transparent roadmap with solutions
D'atalier offers a clear, step-by-step roadmap with practical solutions. This roadmap is tailored to lead your organisation to improved data-driven working.
Data (Maturity) Scan: Optimise Your Data for Insightful Dashboards
To create valuable dashboards, your data must be suitable and well recorded. Our Data (Maturity) Scan assesses your data quality and data management in a practical way, without simply giving a report grade.

Our approach
1. Customer-centric approach:
We identify your issues and desired KPIs for deep insight.
2. Sources:
We inventory all relevant data sources, both internal and external.
3. Data management:
We assess responsibilities and management within your organisation.
The Result:
You will receive a detailed report with options and steps to realise your desired dashboards and insights. We will help you improve your data management and optimise your data for maximum insight.

Invoice Complete
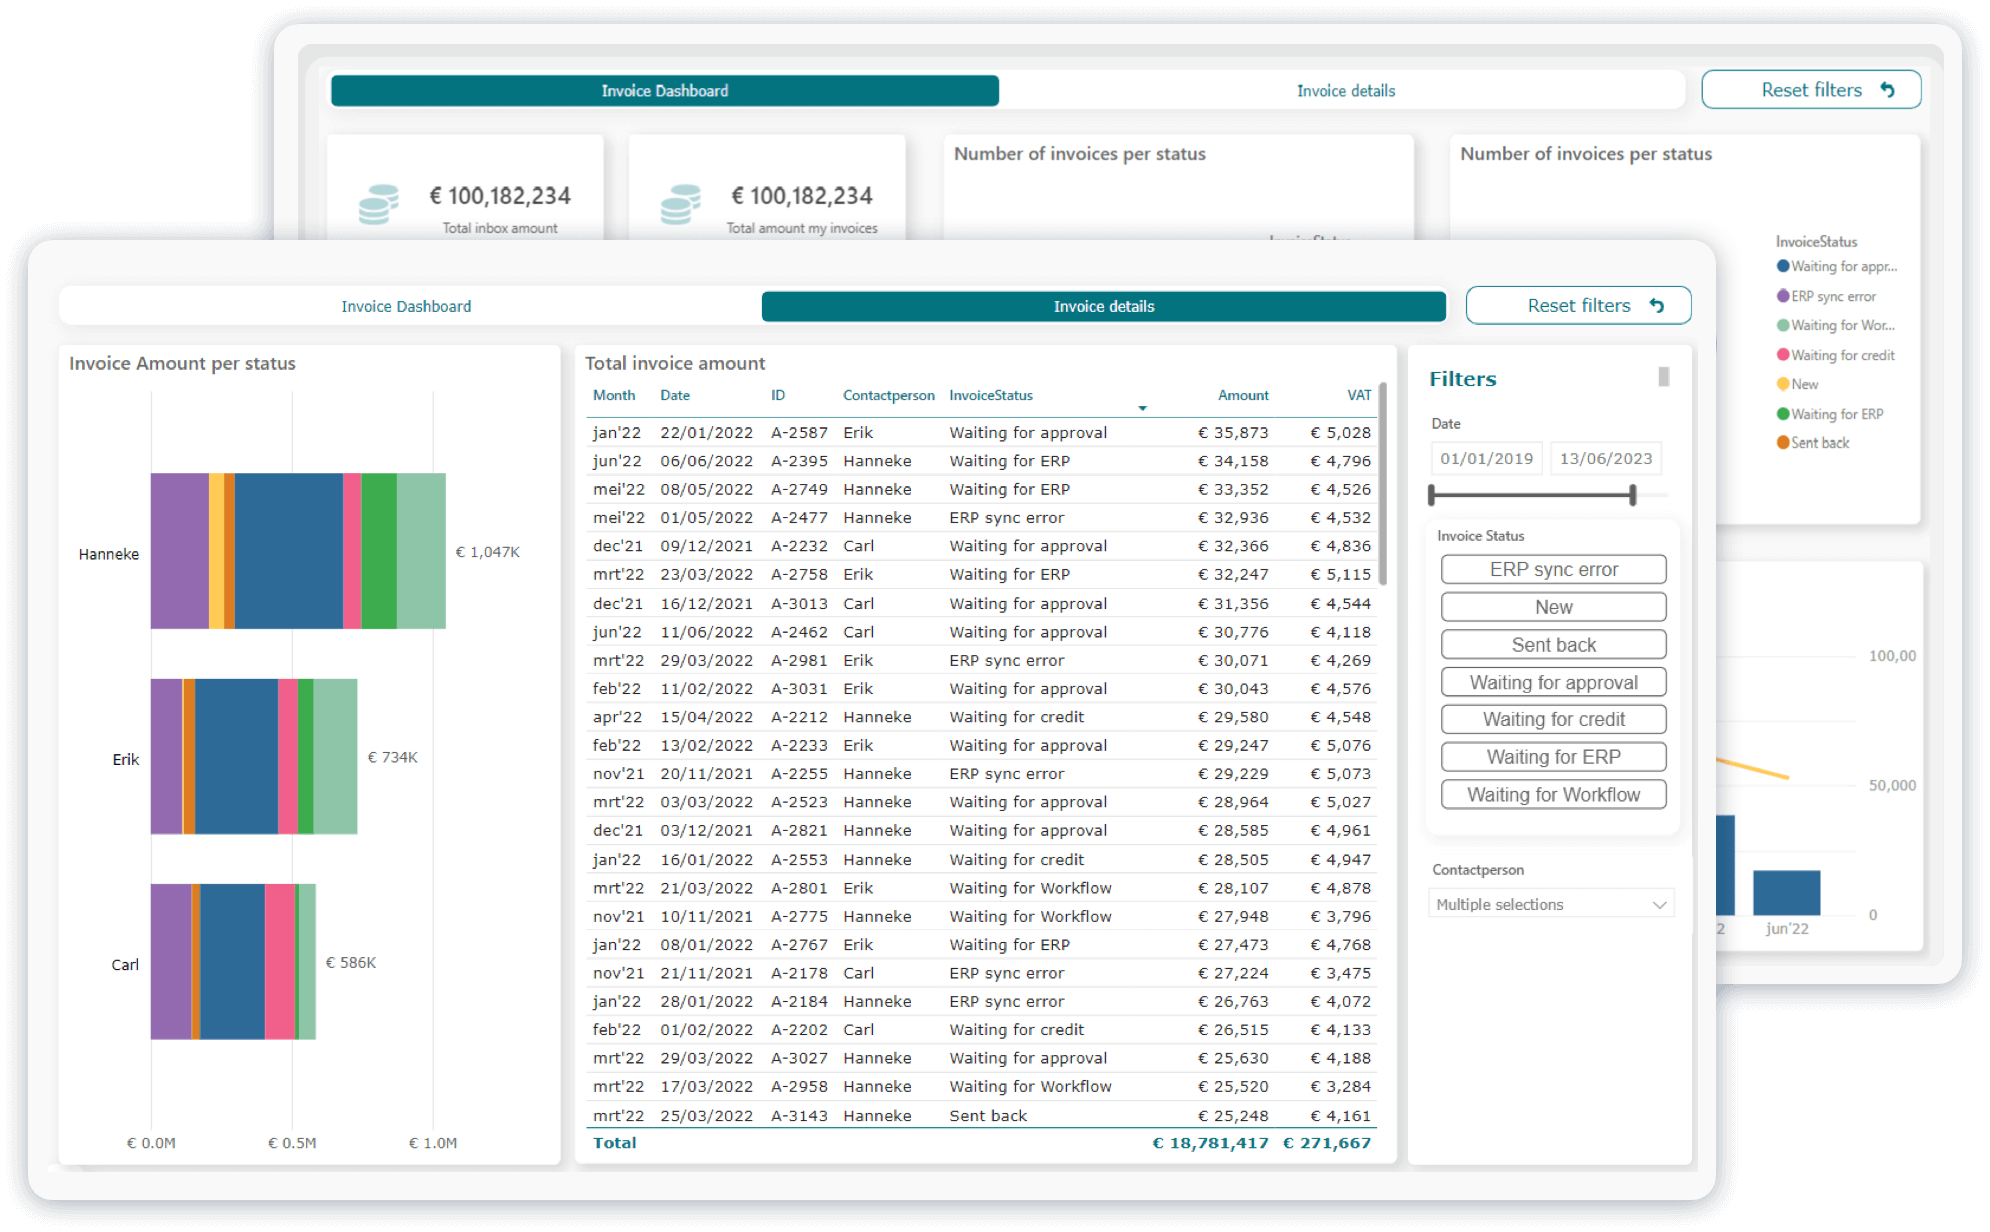
D'atalier has developed an interactive dashboard for InvoiceComplete, giving the company deep insight into the financial data of procurement processes. This dashboard visualises spending patterns, supplier performance and invoice trends using clear charts and tables. The system integrates data from various sources, enabling real-time updates and analysis. Users can easily apply filters to analyse specific data and generate reports.
Rietlanden
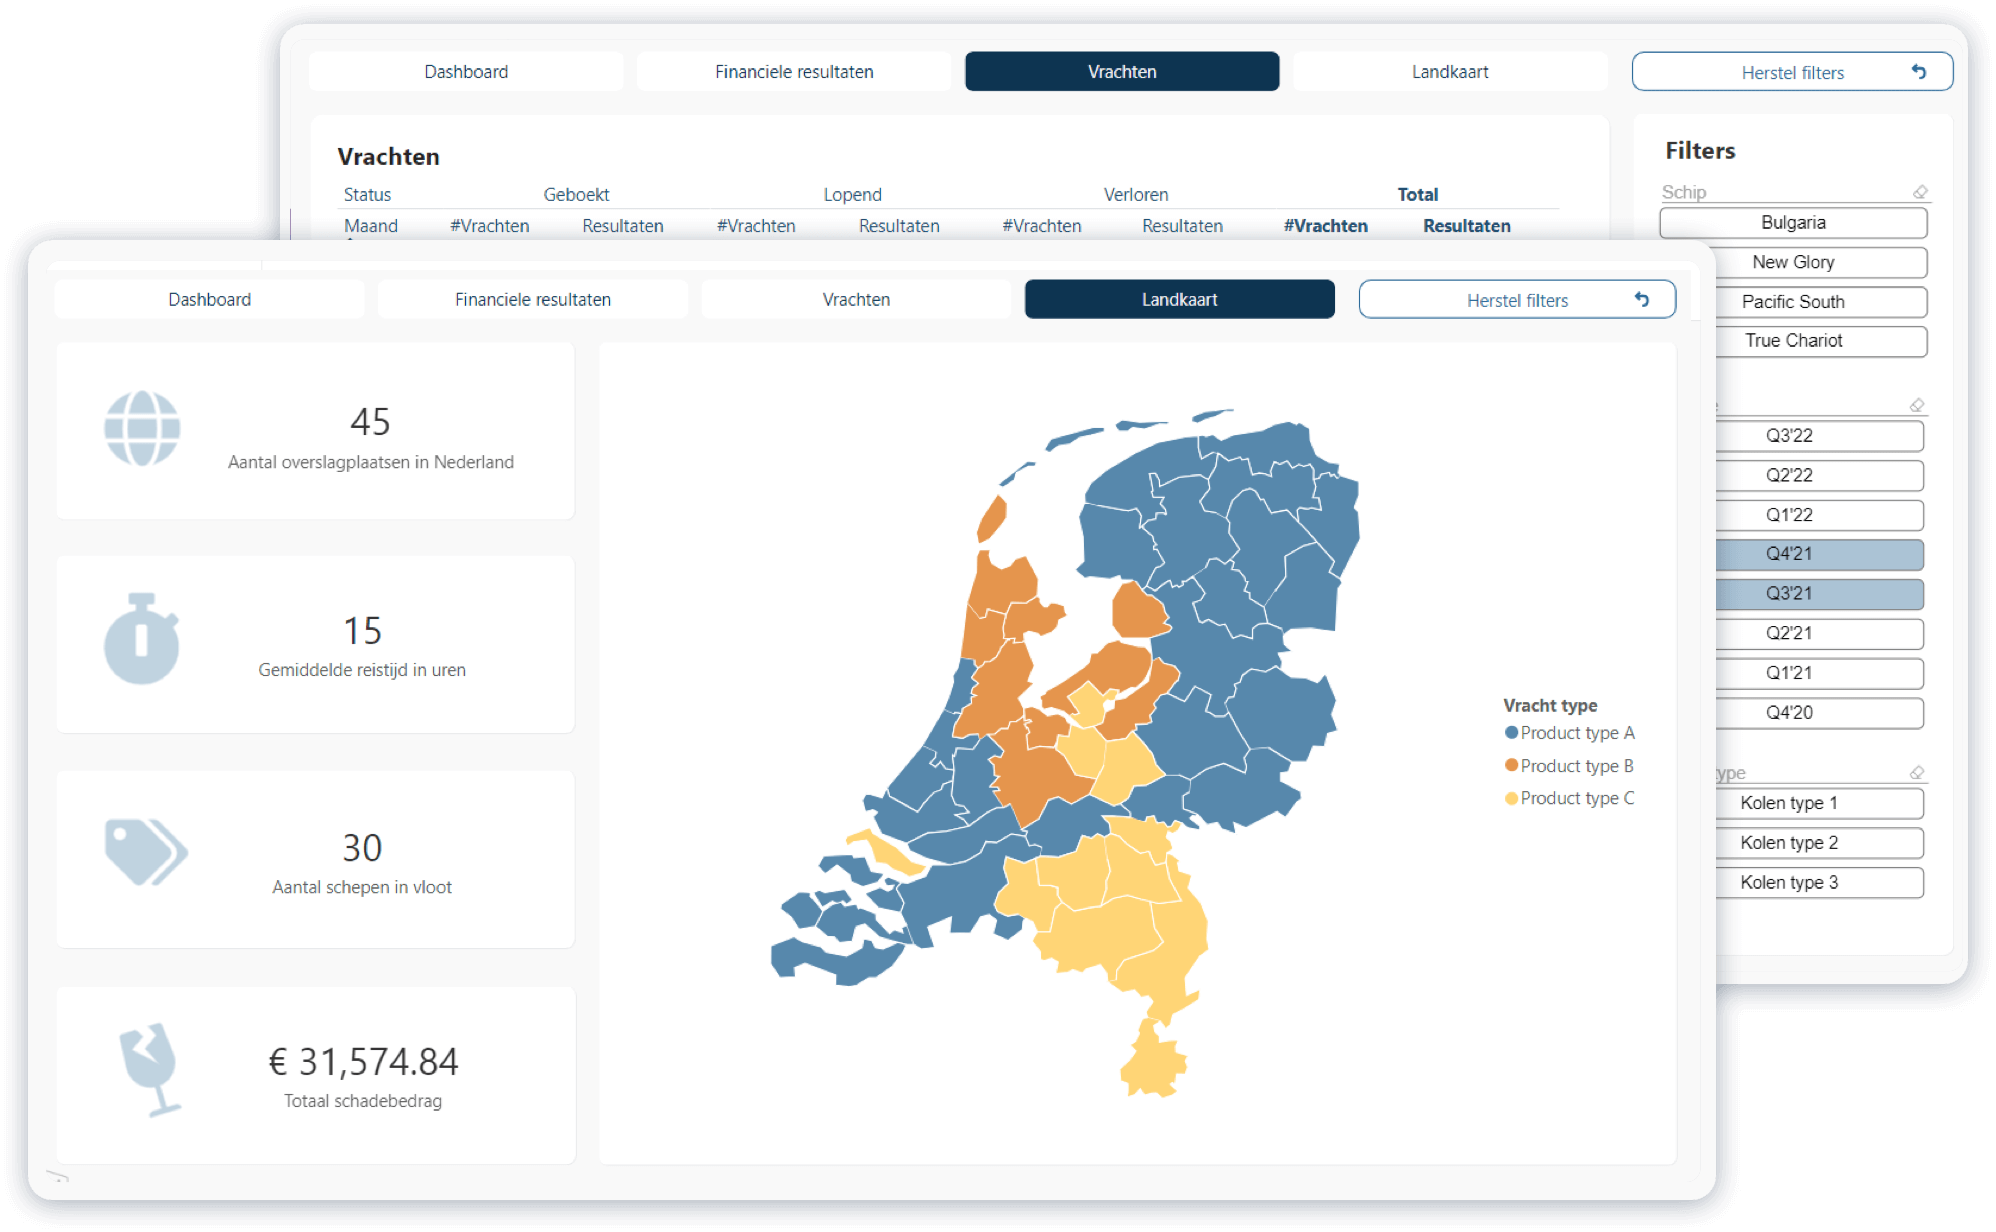
D'atalier has developed an interactive dashboard for Rietlanden that provides the company with in-depth insight into operational data from transshipment operations. This dashboard visualizes logistics patterns, crane and terminal performance, and trend analysis through clear charts and tables. It integrates data from various sources for real-time updates and analysis. Users can easily apply filters for specific data analysis and report generation.
Green Delivr
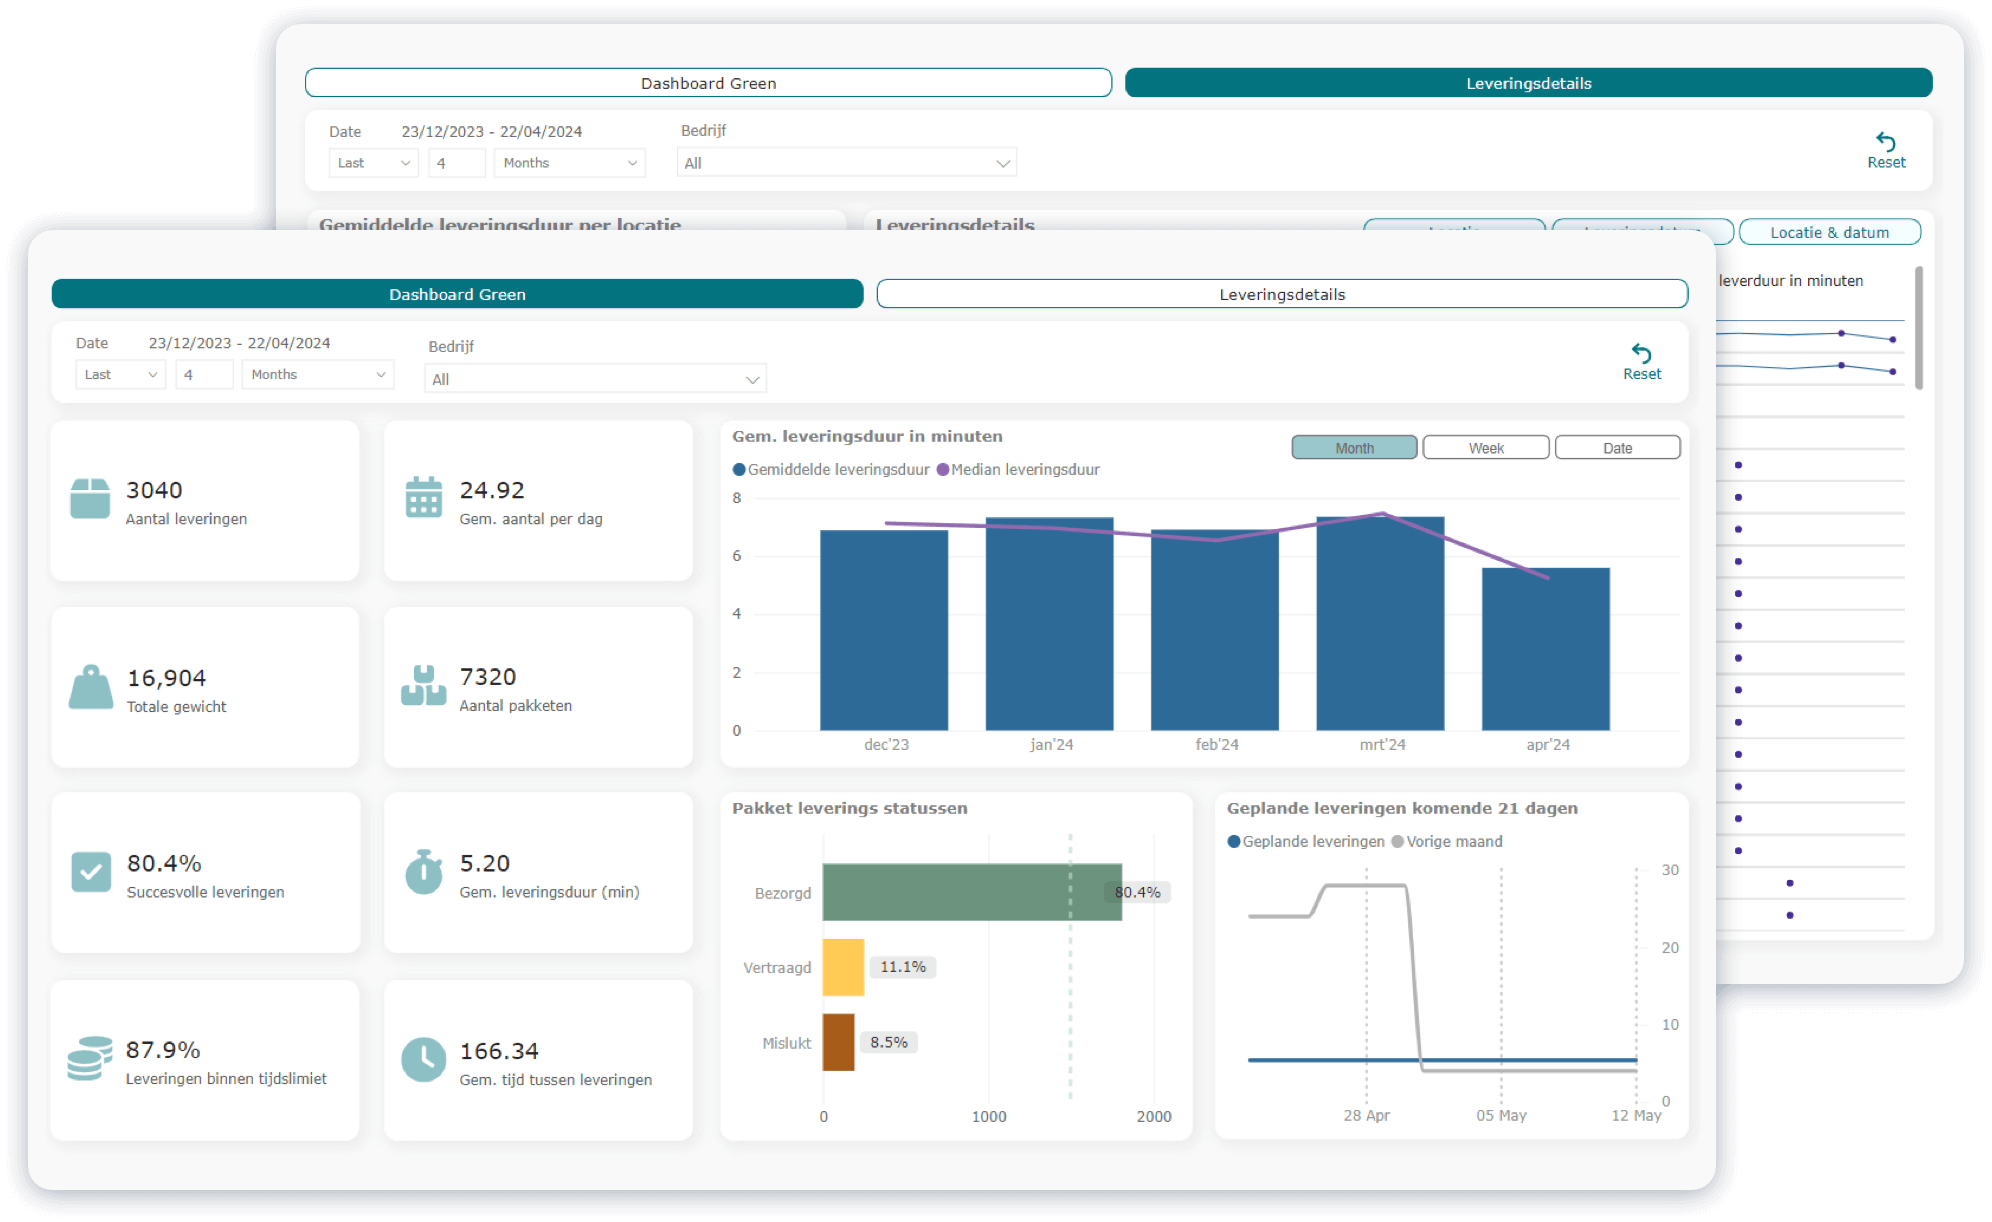
D'atalier has developed an interactive dashboard for GreenDelivr, giving the company deep insight into the logistics data of their last mile delivery services. This dashboard visualizes delivery patterns, courier performance statistics and trend analysis through clear charts and tables. It integrates data from various sources for real-time updates and analysis. Users can easily apply filters for specific data analysis and report generation.
Invoice Complete
D'atalier has developed an interactive dashboard for InvoiceComplete, giving the company deep insight into the financial data of procurement processes. This dashboard visualises spending patterns, supplier performance and invoice trends using clear charts and tables. The system integrates data from various sources, enabling real-time updates and analysis. Users can easily apply filters to analyse specific data and generate reports.
Rietlanden
D'atalier has developed an interactive dashboard for Rietlanden that provides the company with in-depth insight into operational data from transshipment operations. This dashboard visualizes logistics patterns, crane and terminal performance, and trend analysis through clear charts and tables. It integrates data from various sources for real-time updates and analysis. Users can easily apply filters for specific data analysis and report generation.
Green Delivr
D'atalier has developed an interactive dashboard for GreenDelivr, giving the company deep insight into the logistics data of their last mile delivery services. This dashboard visualizes delivery patterns, courier performance statistics and trend analysis through clear charts and tables. It integrates data from various sources for real-time updates and analysis. Users can easily apply filters for specific data analysis and report generation.
Request a demo
Interested in what D’atalier’s dashboarding solutions can do for your business? Contact us for more information or request a demo. Our team is ready to help you take the next step in data-driven decision-making.

